At last, closing out the Power App recreation series. Kicking things off, the first app mocked up Instagram. Nothing fancy, but the app used two galleries populated from two Excel data sources. The second app roughly recreated Netflix and again, used two galleries and two Excel data sources. However, app #2 used the Filter() function and introduced nested galleries.
Switching gears, Power App #3 used a custom list from [SharePoint Online] as its data source. Utilizing the SortByColumns() function, some collection objects, and some custom date formatting, that app prototyped the Office App home feed. Moving onto the fourth app, the OneDrive App photo grid was recreated with a vertical gallery and a SPO document library as its data source. Today, this final app builds on the previous app experiences and loosely recreates a Twitter feed…
Getting started, create a SPO list to house the tweets. SQL Server is ideal, but is a premium connector. Also, Excel would require that the file live in OneDrive. Either way, lists are simple enough for quick proof of concepts. And this dummy list can index:
- user posts,
- number of comments,
- number of likes,
- number of retweets,
- etc.

Associating the tweets with their “user profiles”, this mockup uses a document library to store user profile images. As an alternative, these images could be hosted in Azure Blob Storage, but don’t forget to flag which accounts are “blue checked” and which aren’t:

With two data sources already created, add another document library to the mix. This third data source keeps a record of user tweet attachments. Each attachment is connected to a tweet using lookup column IDs as foreign keys:

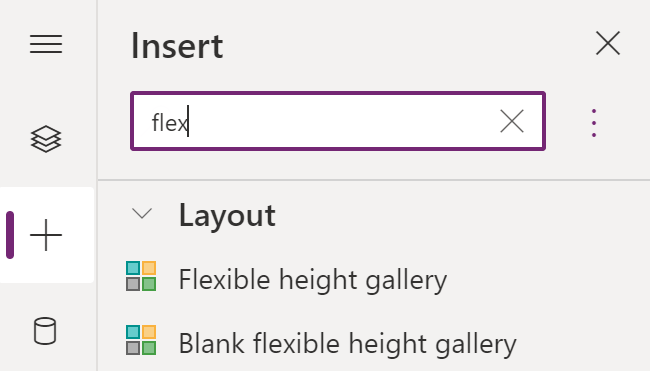
With the three data sources configured, open the Power Apps Studio and create a blank canvas app. Once the environment loads, add a Flexible height gallery to the canvas, add the data sources, then bind the custom list to the gallery. Why flex height gallery? Because tweets differ in character count. Each gallery record height needs to be dynamic, not static:
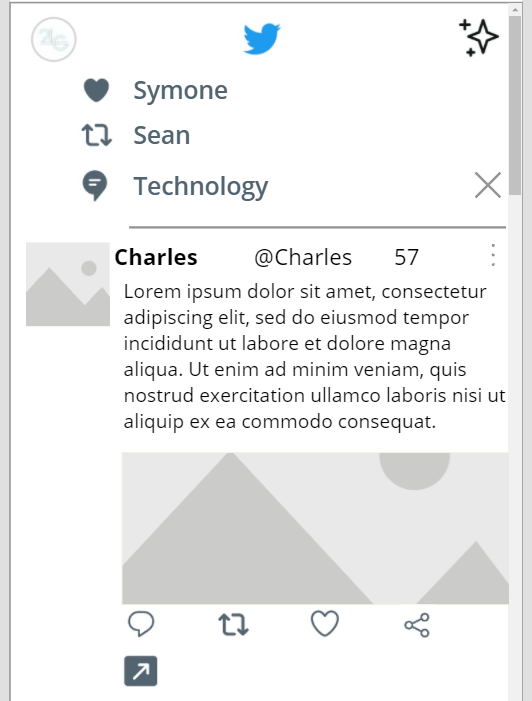
With the gallery data source bound, the app is already resembling a social media feed:
- Fb
- IG
- etc.
For better testing, the dummy tweets should vary in length.

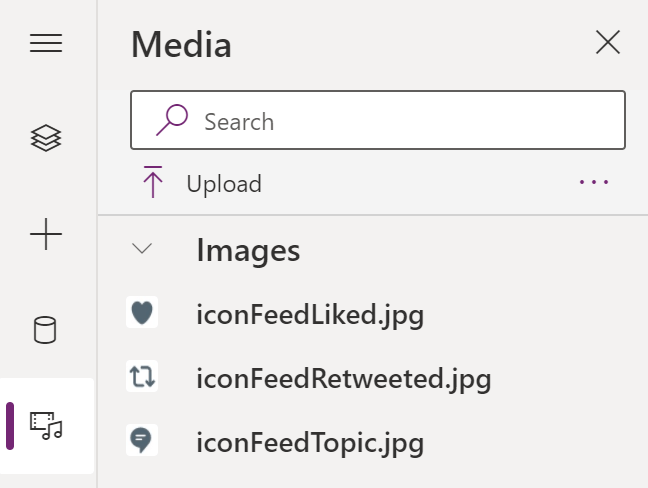
Next step, start adjusting the app aesthetics. Use the Power Apps Media storage section and upload some app icons. The icons are essential to fleshing out the app design:
- E.g.,
- heart icon,
- topic icon,
- comment icon,
- etc.
Introducing a recent-ish feature, Power Apps now supports creating “reusable building blocks” called components. Create once and use as many times as needed. Headers and footers are ideal as components because they’re typically added to each app screen:

Mentioned above, this flex height gallery data source is the SPO custom list. To sort the tweets in descending order, use the SortByColumns() function:
SortByColumns(
    'appMockup-Twitter',
    "Modified",
    Descending
)
With the header component added to the canvas and gallery icons tweaked a bit, things are shaping up.
Presently, all icons, labels, and images on the canvas are static. The icons and labels are repeated in each gallery record. Because tweets aren’t identical to one another, things have to be dynamic. Setting the groundwork, calculate the X, Y, Height, and Width properties of the icons and labels with formulas using the properties of other elements:
- E.g., the “retweeted” icon.
- Y property calculated using properties of the “liked” icon.

For additional tweaking, use the LookUp() function and get each person’s profile image using the label text of their profile handle:
LookUp(
   'appMockup-TwitterProfiles',
   Account = lblAccountMail.Text
).'{Link}'
And use another lookup to verify their “blue check” status. If not verified, then hide the icon by setting its width and height values to 0:
If(
    LookUp(
        'appMockup-TwitterProfiles',
        Account = lblAccountMail.Text,
        IsVerfified
    ) = false,
    0,
    48
)

Tip #1: Image elements are square, but can be rounded by adjusting their border radius.

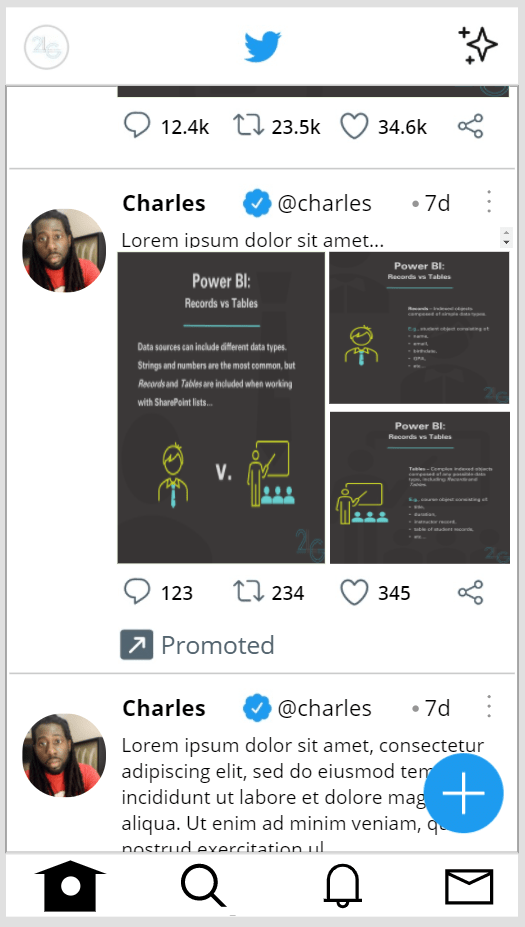
Tip #2: Format the tweet label totals. Reduce counts greater than 1,000.
If(
   Int(ThisItem.NumOfComments) <= 999,
   Text(ThisItem.NumOfComments),
   RoundUp(Int(ThisItem.NumOfComments) / 1000, 1)&"k"
)
- E.g.,
- 123 comments | 123
- 2,345 retweets | 2.4k
- 34,567 likes | 34.6k

Tip #3: Format the elapsed time since tweets were posted. Determine whether displayed in secs, mins, hrs, or days using nested If-Then formulas.
If(
   DateDiff(ThisItem.Modified, Now(), Seconds) <= 59,
   Text(DateDiff(ThisItem.Modified, Now(), Seconds))&"s",
   If(
      DateDiff(ThisItem.Modified, Now(), Minutes) <= 59,
      Text(DateDiff(ThisItem.Modified, Now(), Minutes))&"m",
      If(
         DateDiff(ThisItem.Modified, Now(), Hours) < 23,
         Text(DateDiff(ThisItem.Modified, Now(), Hours))&"h",
         Text(DateDiff(ThisItem.Modified, Now(), Days))&"d"
      )
   )
)
- E.g.,

Final bit of polishing. What if images are a part of the tweet? Data source #3 listed tweets attachments with their tweet IDs as a foreign key/ lookup column. Filter the data source using the ID as a match, then populate image elements:
First(
   Filter(
      'appMockup-TwitterAttachments',
      Lookup.Value = ThisItem.ID
   )
).'{Link}'
If they are no matches, then collapse the image elements. Else, adjust the image element Height properties as needed:
If(
   CountRows(
      Filter(
         'appMockup-TwitterAttachments',
         Lookup.Value = ThisItem.ID
      )
   ) = 0,
   0,
   390
)
Keep in mind that there could be more than one image attached. If so, then dynamically adjust the image element Height and Width properties If-Then conditions.
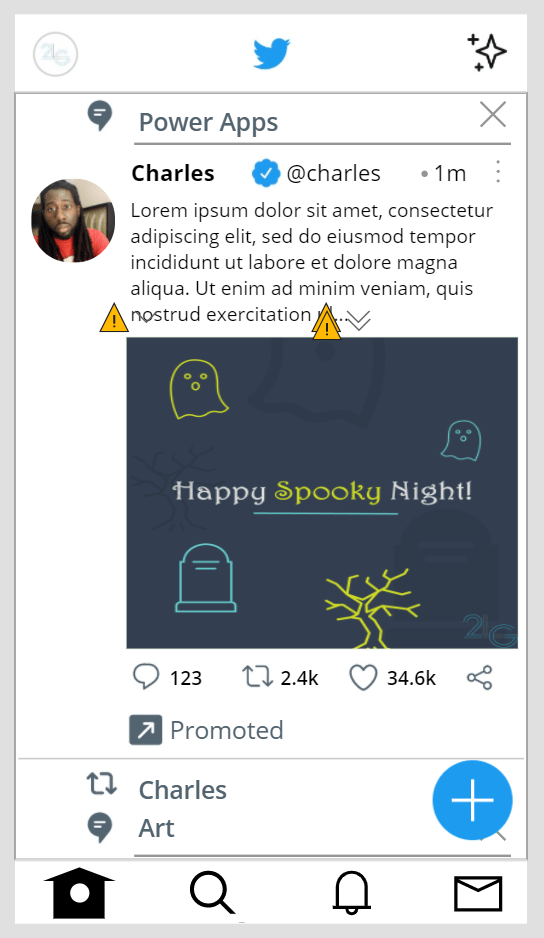
Finally, publish and run the completed app:

Conclusion:
Power Apps can use multiple data sources. Once the data is rigged up, there are plenty of Excel-esque formulas available for formatting and toggling elements. With a bit a patience, even a Twitter-like app could be recreated in a few days…
“If we accept and acquiesce in the face of discrimination, we accept the responsibility ourselves and allow those responsible to salve their conscience by believing that they have our acceptance and concurrence. We should, therefore, protest openly everything… that smacks of discrimination or slander.”
Mary Jane McLeod Bethune
#BlackLivesMatter
