Recap:
Visuals were built in the previous Netflix Viewing Data blog, but no formulas. Still, presenting the year-to-year viewing counts in stacked bar charts was simple enough. And the drilldowns weren’t bad…
Note:
The Netflix viewing history export only includes the first time something is viewed, not each time it is viewed.
However, today I want to match content that my wife and I each watched under our Netflix profiles:
- E.g., did we both watch The Office?
To get started, download the Netflix exports and open Power BI Desktop (because free!).

- Load the Netflix CSVs as data sources.

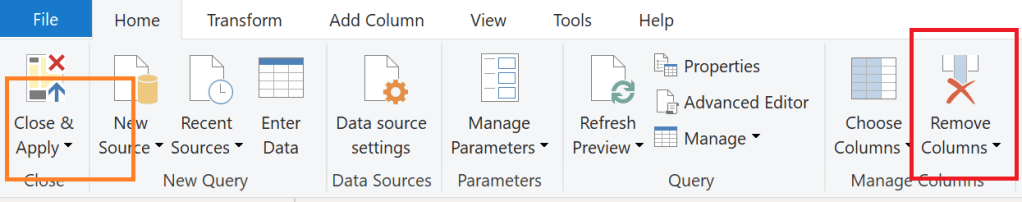
- Load the CSVs separately, but Transform Data for each CSV first.

- Remove Columns:
- Date
Optional:
Rename the tables post load: Him and Her.

Note:
Every column is removed except Title because INTERSECT looks to match the entire row. Because my wife and I watched things on different days, the dates would differ. Thus there would be no row matches on Title AND Date.
- Open the Data pane and create New table.
- This table will list the matches.
- Use INTERSECT to return the commonalities.
- e.g., Overlap

Overlap = INTERSECT('Her','Him')
SUCCESS:
There are 110 matches in the viewing history data sources and The Office is one of them…

Conclusion:
We have some shared viewing preferences. At least 110 things… Thanks, INTERSECT!
“To understand how any society functions you must understand the relationship between the men and the women.”
Angela Davis
